.png)
Audience Analytics
Audience Analytics provides insights into your readers’ engagement behavior and informs the actions you can take to optimize your community further.
Overview metrics
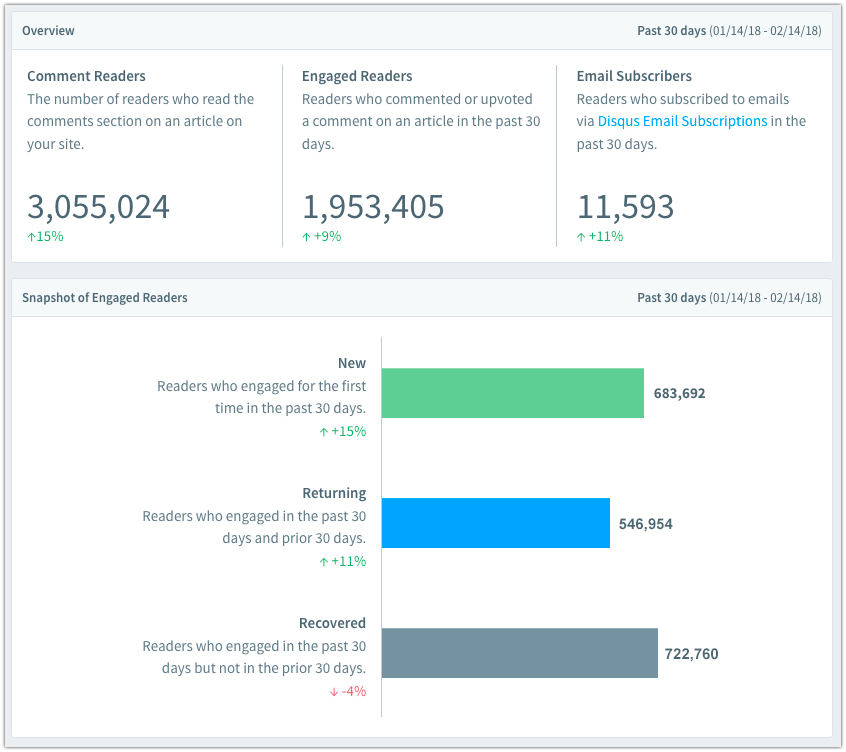
Use the Overview metrics to understand how your community is growing and to measure the overall impact of your current engagement strategy.
- Comment readers: Total users who read the comments on your site
- Engaged readers: Total users who have either commented or voted on a comment
- Email subscribers: Total users who have opted into your email list via the Email Subscriptions feature
Snapshot of engaged readers
Drill down further for a breakdown of total New, Returning, and Recovered users to see how each segment is represented in your community and their respective growth rate.
- New: Engaged for the first time on your site in the past 30 days
- Returning: Engaged on your site in the past 30 days as well as the prior 30 days
- Recovered: Engaged on your site in the past 30 days but not in the prior 30 days
Your community member overview
Use the Community Members table to view each user's profile, including their total engagements (comments + votes), the date of their first and most recent engagements, and their engagement status.
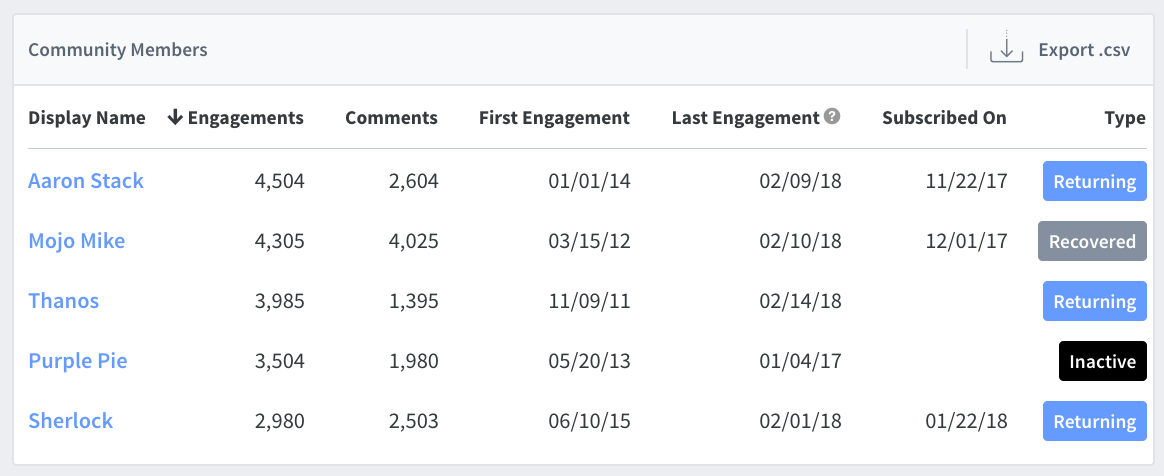
To sort any of these columns using a column header to identify exciting segments of your community, for example, “recently acquired users” or “most active commenters.”
Click Export CSV to receive a CSV email attachment. Downloading the data from Disqus can help perform a deeper analysis, especially if you want to combine Disqus user attributes with other audience data you have.
Data is available as far back as a year ago.
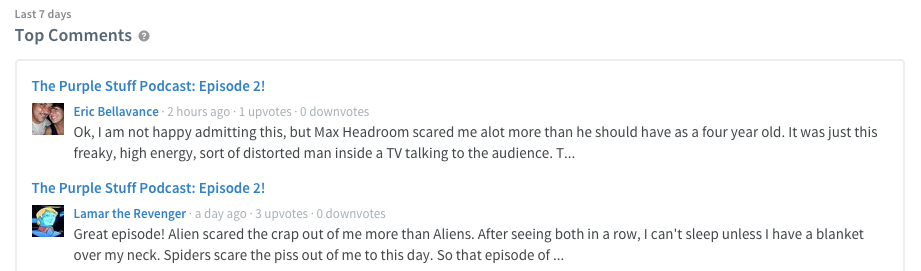
Top comments spotlight
These comments have received the most positive voting ratios over the past 7 days. This section can help you identify new and active users in your forum.
If you want to use your analytics tool to capture commenting activity, see our help documentation here.
Reactions Analytics
Reactions Analytics let you dig deeper into how your audience is responding to your content via the Reactions engagement feature. The beauty of Reactions Analytics is that they let you determine your known and unknown users, since readers don’t need to log in to react to an article. Thus, the analytics data showcases your authenticated (logged-in) and anonymous users. This can help publishers understand how their anonymous readers react to their content so they can convert them into loyal, logged-in users.
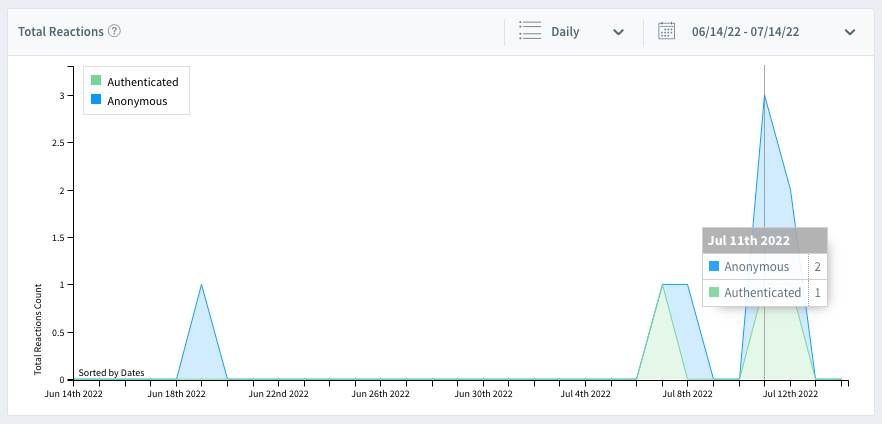
Total Reactions
By default, the top graph of the Reactions Analytics page will show the total number of reactions left on the site by date. Since anyone can click Reactions, we break the data into Anonymous (logged-out reaction clicks) and Authenticated (logged-in reaction clicks). You may adjust the Date Range selector in the top right corner of the graph to change which dates appear.
Alternatively, you may change the “Daily” option in the top graph to “Threads.” The graph will then display the reaction count by thread for the 30 most recent threads.
Thread-specific reactions
While the top graph on the page will allow you to see total Reactions by thread, the bottom graph will allow you to drill deeper, seeing the breakdown of specific Reactions for a given thread.
Selecting a date range in the top right corner of the bottom graph will populate the Threads section at the top of that graph, showing up to 30 threads published within the selected date range. Choosing a given thread will then show how many of each Reaction were left on the thread. The Reactions images used will appear above the graph for reference.